The browser you are using is not supported. Please consider using a modern browser.

A Comprehensive Guide to Comparing Natural Gas Rates

Key Takeaways
- With Natural Gas Choice, consumers can choose a third-party natural gas supplier rather than being restricted to their local utility’s default rate.
- Switching providers allows customers to lock in fixed-rate plans to avoid seasonal price spikes, potentially reduce their monthly bill with lower rates per therm (or CCF).
- When a customer switches suppliers, the local utility continues to deliver the gas, maintain the infrastructure, and handle billing and emergencies. The only change is the supply rate and the company that sources the energy.
- Currently residents in several states, including Illinois, Maryland, Michigan, New York, Ohio, and Pennsylvania can choose their natural gas provider.
Table of Contents

U.S. natural gas production is set to reach record highs in 2026 and 2027, but many Americans are still paying higher natural gas prices.
If you’re a homeowner, renter, or business owner trying to save money, here’s the good news: in many places, you can compare natural gas supply rates (the part you can shop) and pick a plan that fits your budget—without changing your pipes, your meter, or your service reliability. In many states with Natural Gas Choice, your utility delivers the gas while natural gas providers set the price, so shopping can directly impact how much you pay on your monthly electricity bill.
How to Compare Natural Gas Rates?
- The short answer to this question is to look at the price per therm that you are currently paying on your bill.
- Additional factors you will want to consider when shopping for natural gas plans include plan type (fixed vs. variable), contract length, and fees found in the terms and conditions.
- Compare offers available in your ZIP Code and choose the plan that matches your goals—usually a fixed-rate plan if you want predictable bills.
Your utility still delivers the gas, but your chosen provider sets the supply rate in competitive markets.
Shop Natural Gas Rates
Average Natural Gas Rates by State
Hawaii has by far the highest residential natural gas prices in the U.S., followed by New England and Florida, all well above the national average. In contrast, states such as Idaho, Iowa, and Minnesota rank at the bottom of the price rankings, with residential rates often less than half the U.S. average.
High-priced states tend to be geographically isolated or far from production, rely on constrained pipelines or imported LNG, and carry higher regulatory, infrastructure, and decarbonization costs that are spread over relatively lower gas usage per customer. Low-priced states benefit from proximity to major producing basins and interstate pipelines, higher gas throughput per mile of pipe (especially for winter heating), and, in some cases, more competitive or cost‑conscious regulatory structures.
Average residential natural gas prices by state are reported in dollars per thousand cubic feet (Mcf). However, it’s easier and more common to see natural gas prices in dollars per therm.
A common rule of thumb is:
- 1 therm ≈ 100 cubic feet
- 1 Mcf (1,000 cubic feet) ≈ 10 therms
So $/therm ≈ $/Mcf ÷ 10 (rounded).
Important note: Some states show NA in the source report (not available / not reported in that specific dataset).
| State | Average $/Therm |
|---|---|
| Alabama | $1.93 |
| Alabama | $1.93 |
| Alaska | $1.33 |
| Arizona | $1.99 |
| Arkansas | $2.48 |
| California | N/A |
| Colorado | $1.09 |
| Connecticut | $1.63 |
| Alabama | $1.93 |
| Delaware | $1.88 |
| Hawaii | $5.79 |
| Idaho | $0.72 |
| Illinois | $1.06 |
| Iowa | $0.77 |
| Kansas | $1.43 |
| Kentucky | $1.40 |
| Lousiana | $2.17 |
| Maine | N/A |
| Maryland | $1.75 |
| Massachusetts | $2.26 |
| Michigan | $1.07 |
| Minnesota | $0.80 |
| Mississippi | $1.82 |
| Missouri | $1.65 |
| Montana | $0.93 |
| Nebraska | $1.36 |
| Nevada | $1.20 |
| New Hampshire | $1.81 |
| New Jersey | $1.47 |
| New Mexico | $0.97 |
| New York | $1.80 |
| North Carolina | $2.05 |
| North Dakota | $0.96 |
| Ohio | $1.33 |
| Oklahoma | N/A |
| Oregon | $1.74 |
| Pennsylvania | $1.53 |
| Rhode Island | $3.30 |
| South Carolina | $1.73 |
| South Dakota | $0.82 |
| Tennessee | $1.32 |
| Texas | $2.56 |
| Utah | $1.02 |
| Vermont | $1.88 |
| Virginia | $1.66 |
| Washington | $1.67 |
| West Virginia | $1.48 |
| Wisconsin | $1.09 |
| Wyoming | $1.28 |


Switching Natural Gas Providers Should Be Simple
Compare rates from leading providers and make the switch in only a few minutes.
What to Look for When Selecting a Natural Gas Plan
Natural gas plans can look “cheap” at first glance… and then surprise you like a movie sequel nobody asked for. Here’s what to check before you commit.
Natural Gas Terms You Need to Know
First, before switching your natural gas plan, here’s the “gas dictionary”.
- Therm: Common billing unit for home gas use; 1 therm ≈ 100 cubic feet.
- Mcf: 1,000 cubic feet, often used in state price reporting.
- Supply charge: The price of the natural gas itself (the part you may be able to shop).
- Delivery charge: The utility’s cost to move gas through pipes to your home, which is not changeable for most Americans.
- Utility vs. provider / supplier: In many parts of the country, the utility delivers the gas, and the provider sets the supply rate.
1) Price per therm
Your supply rate is often quoted per therm. Rates vary by state and plan type, and can fluctuate with demand and market conditions such as supply shortages, winter storms, and pipeline delivery issues.
2) Fixed vs. variable rate
- Fixed-rate plans: Your price per therm stays the same for the contract term, which gives you predictability and peace of mind but not the lowest rates.
- Variable-rate plans: Your price can change month-to-month, which can give you a short-term discount, but introduces long-term risk as the market has become more volatile in recent years.
If you like stable budgeting, fixed-rate is usually the safest option.
3) Contract length
Common natural gas terms are 6, 12, or 24 months. Longer terms may help avoid seasonal spikes, but only if you’re likely to stay put for a while.
4) Fees and fine print
Watch for:
- Monthly customer charges
- Minimum usage fees
- Early termination fees (ETFs)
5) Your bill might be higher even if gas prices are “low.”
This is the sneaky part, the gas commodity isn’t the only cost. Infrastructure, delivery, and utility charges can climb even when fuel prices don’t.
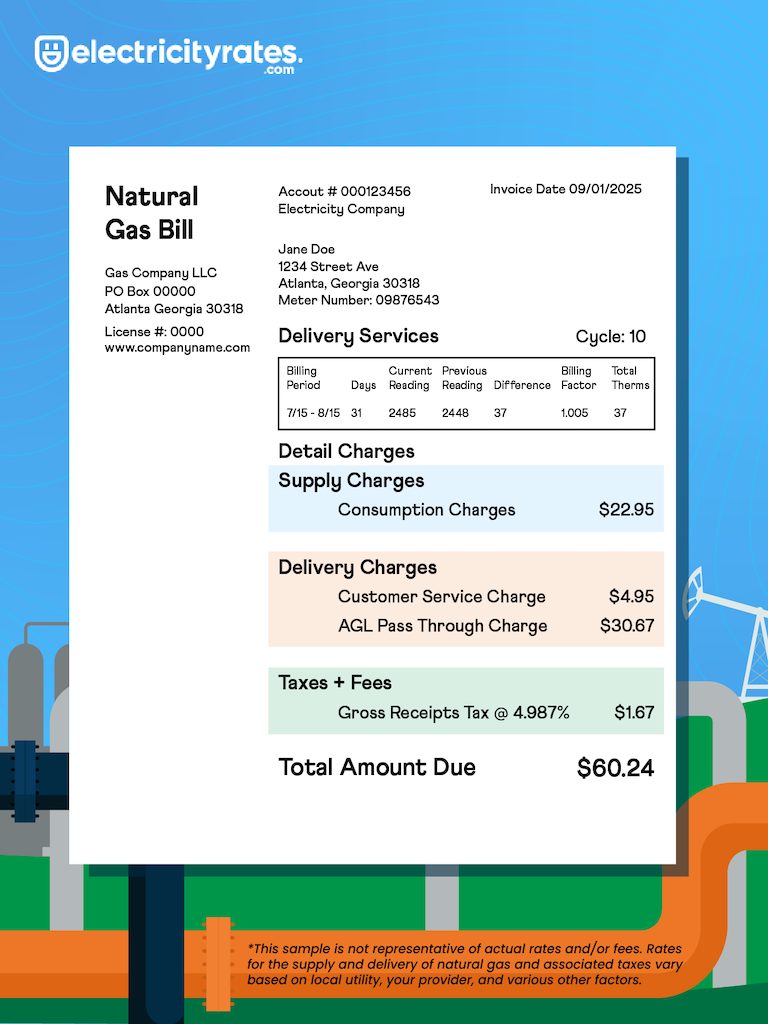
One NPR report explains that utilities have ramped up construction spending on infrastructure and that customers can pay more for delivery charges, sometimes making the bill feel disconnected from the commodity market price. That is why it is imperative to understand that the breakdown of costs in your natural gas bill is split into two main sections:
- Supply charges: The cost of the gas itself; these costs fluctuate based on usage and market prices.
- Delivery charges: Fees for transporting gas via pipelines and for maintaining infrastructure and 24/7 service. These are usually fixed monthly fees plus usage-based costs.
States with Deregulated Natural Gas
Natural gas “deregulation” (a.k.a. energy choice) generally means you may be able to choose a natural gas provider for the gas supply portion of your bill, while your utility still delivers it.
Two helpful reminders from industry explainers:
- Not every state offers choice statewide—sometimes it depends on the utility territory.
- Deregulation expanded in the 1990s, but participation varies across states and by program rules.
If you live in one of these states, you can shop for natural gas plans in at least parts of the state:
Georgia
Georgia is a natural gas powerhouse in the Southeast. While the state doesn’t produce its own gas, it is a massive consumer and a critical hub for regional transit. Natural gas is the backbone of Georgia’s grid, fueling over 40% of its electricity generation.
Pennsylvania
PA has one of the most established gas choice environments. Pennsylvania’s Natural Gas Choice and Competition Act opened competition, allowing customers to compare providers while utilities still deliver the gas.
Ohio
Ohio is a natural gas heavyweight in the Midwest, as it’s a major producer thanks to its position atop the Utica and Marcellus shales. Most Ohioans are automatically enrolled in a Standard Choice Offer (SCO)—a market-based default rate—unless they proactively switch to a competitive retail supplier or join a local government aggregation pool.
Texas
Texas is energy country. Even when electricity headlines steal the spotlight, gas matters because it fuels a big share of power generation nationwide (and Texas is a major driver of that story). EIA’s STEO projects gas remains a huge slice of U.S. generation while LNG exports rise—both can influence demand and pricing dynamics Texans feel.
California
California’s relationship with natural gas is… complicated. There’s strong pressure toward electrification, but gas is still a meaningful heating and power fuel in many areas. Nationally, EIA highlights how cold snaps and supply disruptions can spike prices, and California can feel those wholesale ripples even with its unique policies.
Connecticut
Connecticut consumers often see higher energy costs, so shopping (where available) can matter. Connecticut also sits in a region where winter demand can be intense, which is exactly the kind of scenario EIA calls out when discussing price spikes tied to heating demand.
Illinois
Illinois is frequently listed among states with both electricity and gas choice options. It’s also in the Midwest demand belt, so when winter hits hard, the market tightens fast.
Maine
Maine is commonly included in “deregulated energy” lists, but actual availability can vary by region and program rules. Because Maine winters are no joke, comparing plan terms (especially fixed vs. variable) can be extra important.
Maryland
Maryland is a state where customers can choose providers in many utility areas. If you’re near D.C., pay attention to marketer vs. utility supply differences—EIA tracks pricing splits like this in selected-state reporting.
Massachusetts
Massachusetts is a heavy gas-heat state. EIA consumption data shows that Massachusetts residential deliveries are a large portion of total delivered volumes. That’s why even small per-unit price differences can show up loudly on winter bills.
Michigan
Michigan uses a lot of natural gas across sectors; EIA’s state data shows total consumption over 1,000,000 million cubic feet in 2024. In practical terms, there’s plenty of market activity, so compare contract details carefully, not just the headline rate.
New Hampshire
New Hampshire appears on many deregulation lists, but local availability still hinges on utility territory. If you’re shopping, fixed-rate stability can be attractive because New England weather can whip prices around.
New Jersey
New Jersey is both a large gas-heating state and a significant gas-for-power state; EIA shows substantial 2024 volumes delivered to residential customers and high electric power consumption. That mix makes NJ prices sensitive to both winter heating demand and power-market demand.
New York
New York is commonly included as a gas choice state in many utility territories. Because demand can be very seasonal, always compare “what happens after the intro period” if you’re offered a teaser.
Rhode Island
Rhode Island often lands on lists of places with competitive provider options. It also shows up among the highest-priced states in the rate comparison table above—so shopping can be especially worthwhile.
Virginia
Virginia is commonly cited for natural gas choice in certain utility territories. If you’re eligible, compare provider rates, remembering that delivery charges usually won’t change.
Washington, D.C.
Washington, D.C., is frequently described as benefiting from “complete deregulation” in broad energy-choice discussions. EIA’s selected-state pricing table shows D.C.’s 2024 average residential price for delivered natural gas.
The bottom line: Comparing rates for natural gas isn’t about finding a single, low price. Instead, the goal is to find the optimal combination of the price per therm and the plan structure that aligns with your household’s usage and lifestyle. Once you’ve identified this ideal match, it’s crucial to secure the rate to protect yourself against potential market volatility.
Natural Gas FAQ's
-
The “Price to Compare” (or similar term) is typically your utility’s default supply rate—the benchmark you can use to see if a competitive provider’s offer is actually cheaper. In many choice markets, the utility still delivers the gas, but supply pricing can come from different providers.
-
If you smell gas, treat it like a real emergency: leave the area and contact your local gas utility/emergency line immediately. Your provider choice doesn’t change who responds to safety issues—utilities manage the delivery system.
-
Likely no, if you enroll with a natural gas provider, your default utility will still bill you for delivery and usage components. It is recommended to confirm this with your local utility and provider as some states may vary from consolidated billing.
-
Many plans roll into a month-to-month rate after the term ends—sometimes at a higher variable rate—so it’s smart to set a calendar reminder a few weeks before your contract expiration to compare again. Variable-rate changes and post-term pricing are common risks discussed in deregulated market discussions.