The browser you are using is not supported. Please consider using a modern browser.

Consumers in deregulated electricity markets saved $300B over the past decade, report says
There has been a lot of discussion on whether deregulated states are really benefiting from price competition. There have also been discussions to move some deregulated states back to being regulated as provider scams and complaints increase.
It’s true, electricity prices in deregulated states are high. However, they are starting to drop thanks to the lowering price of natural gas and the flatlining electricity demand. States with a regulated electricity market cannot claim the same.
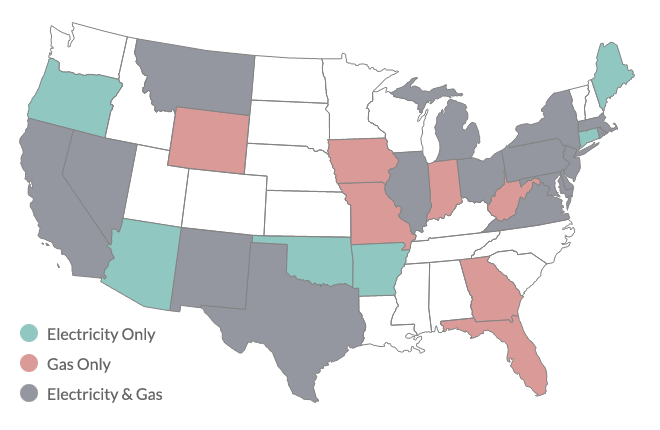
RESA Power, LLC, the industry leader in electrical life extension products and services, conducted research of price trends of 35 U.S. monopoly states with the 14 U.S. jurisdictions that allow competition over the last decade. RESA released their findings in a detailed report called The Great Price Divergence.
Between 2008 and 2017, RESA’s analysis showed the all-sector annual weighted average price in the monopoly states was 18.7% higher in 2017 than in 2008. For retail competitive markets, the all-sector annual weighted average price was 7% lower in 2017 than in 2008.
“In the last decade we have seen either flat or lower demand for electricity combined with the shift toward natural gas,” RESA Executive Director Tracy McCormick said in a statement. “But what’s most unsettling is that, while it affects every single state, it is consumers in monopoly states who are paying the price.”
If 2008-2017 annual percentage price changes in the monopoly states had tracked with percentage price changes in the competitive jurisdictions, “all consumers in the monopoly states would have paid one-third of a trillion dollars ($331.8 billion) less,” the report says.
According to the report, the commercial sector would have benefited the most saving $139.9 billion. The residential sector would have saved $109.9 billion and the industry would have saved $83.5 billion.
Broken out by sector;
- The residential weighted average price in the monopoly states was 22.3% higher in 2017 than in 2008 compared to just a 2.4% increase in the choice jurisdictions.
- The commercial weighted average price increased by 16.3% in the monopoly states but declined by 11.7% in the choice jurisdictions.
- The industrial weighted average price in the monopoly states rose by 11.8% yet declined by 21.1% in the competitive markets.
To conclude, electricity consumers paid over $331 billion more for power in regulated states over the past decade than if percentage price change trends in those states had been the same as those in deregulated states.
Therefore, the challenge is not to explain differences in nominal electricity price levels, but to explain the substantial differences in the directionality of electricity price trends between regulated and deregulated states.
